10 Summary reports
10.1 Prerequisites
In this chapter we will focus on how to set and get EnergyPlus simulation outputs using the eplusr package. We will illustrate the manipulation of simulation data using tidyverse, and use ggplot2 to visualize the simulation data.
We will be working with the IDF and EPW file that pertains to the U.S. Department of Energy (DOE) Commercial Reference Building and Chicago’s TMY3 respectively.
10.2 Output summary reports
To output the summary reports from EnergyPlus, you need to first run the
simulation. The object job in the code below belongs to the EplusJob class.
If you set dir = NULL, the simulation results will not be saved into a
temporary directory but instead in the folder containing the IDF file. Do that
and you will find the summary report in a html file as illustrated in Figure
10.1.
job <- model$run(epw, dir = tempdir())
## ExpandObjects Started.
## No expanded file generated.
## ExpandObjects Finished. Time:     0.052
## EnergyPlus Starting
## EnergyPlus, Version 9.4.0-998c4b761e, YMD=2023.03.09 00:26
## Could not find platform independent libraries <prefix>
## Could not find platform dependent libraries <exec_prefix>
## Consider setting $PYTHONHOME to <prefix>[:<exec_prefix>]
##
## Initializing Response Factors
## Calculating CTFs for "STEEL FRAME NON-RES EXT WALL"
## Calculating CTFs for "IEAD NON-RES ROOF"
## Calculating CTFs for "EXT-SLAB"
## Calculating CTFs for "INT-WALLS"
## Calculating CTFs for "INT-FLOOR-TOPSIDE"
....
class(job)
## [1] "EplusJob" "R6"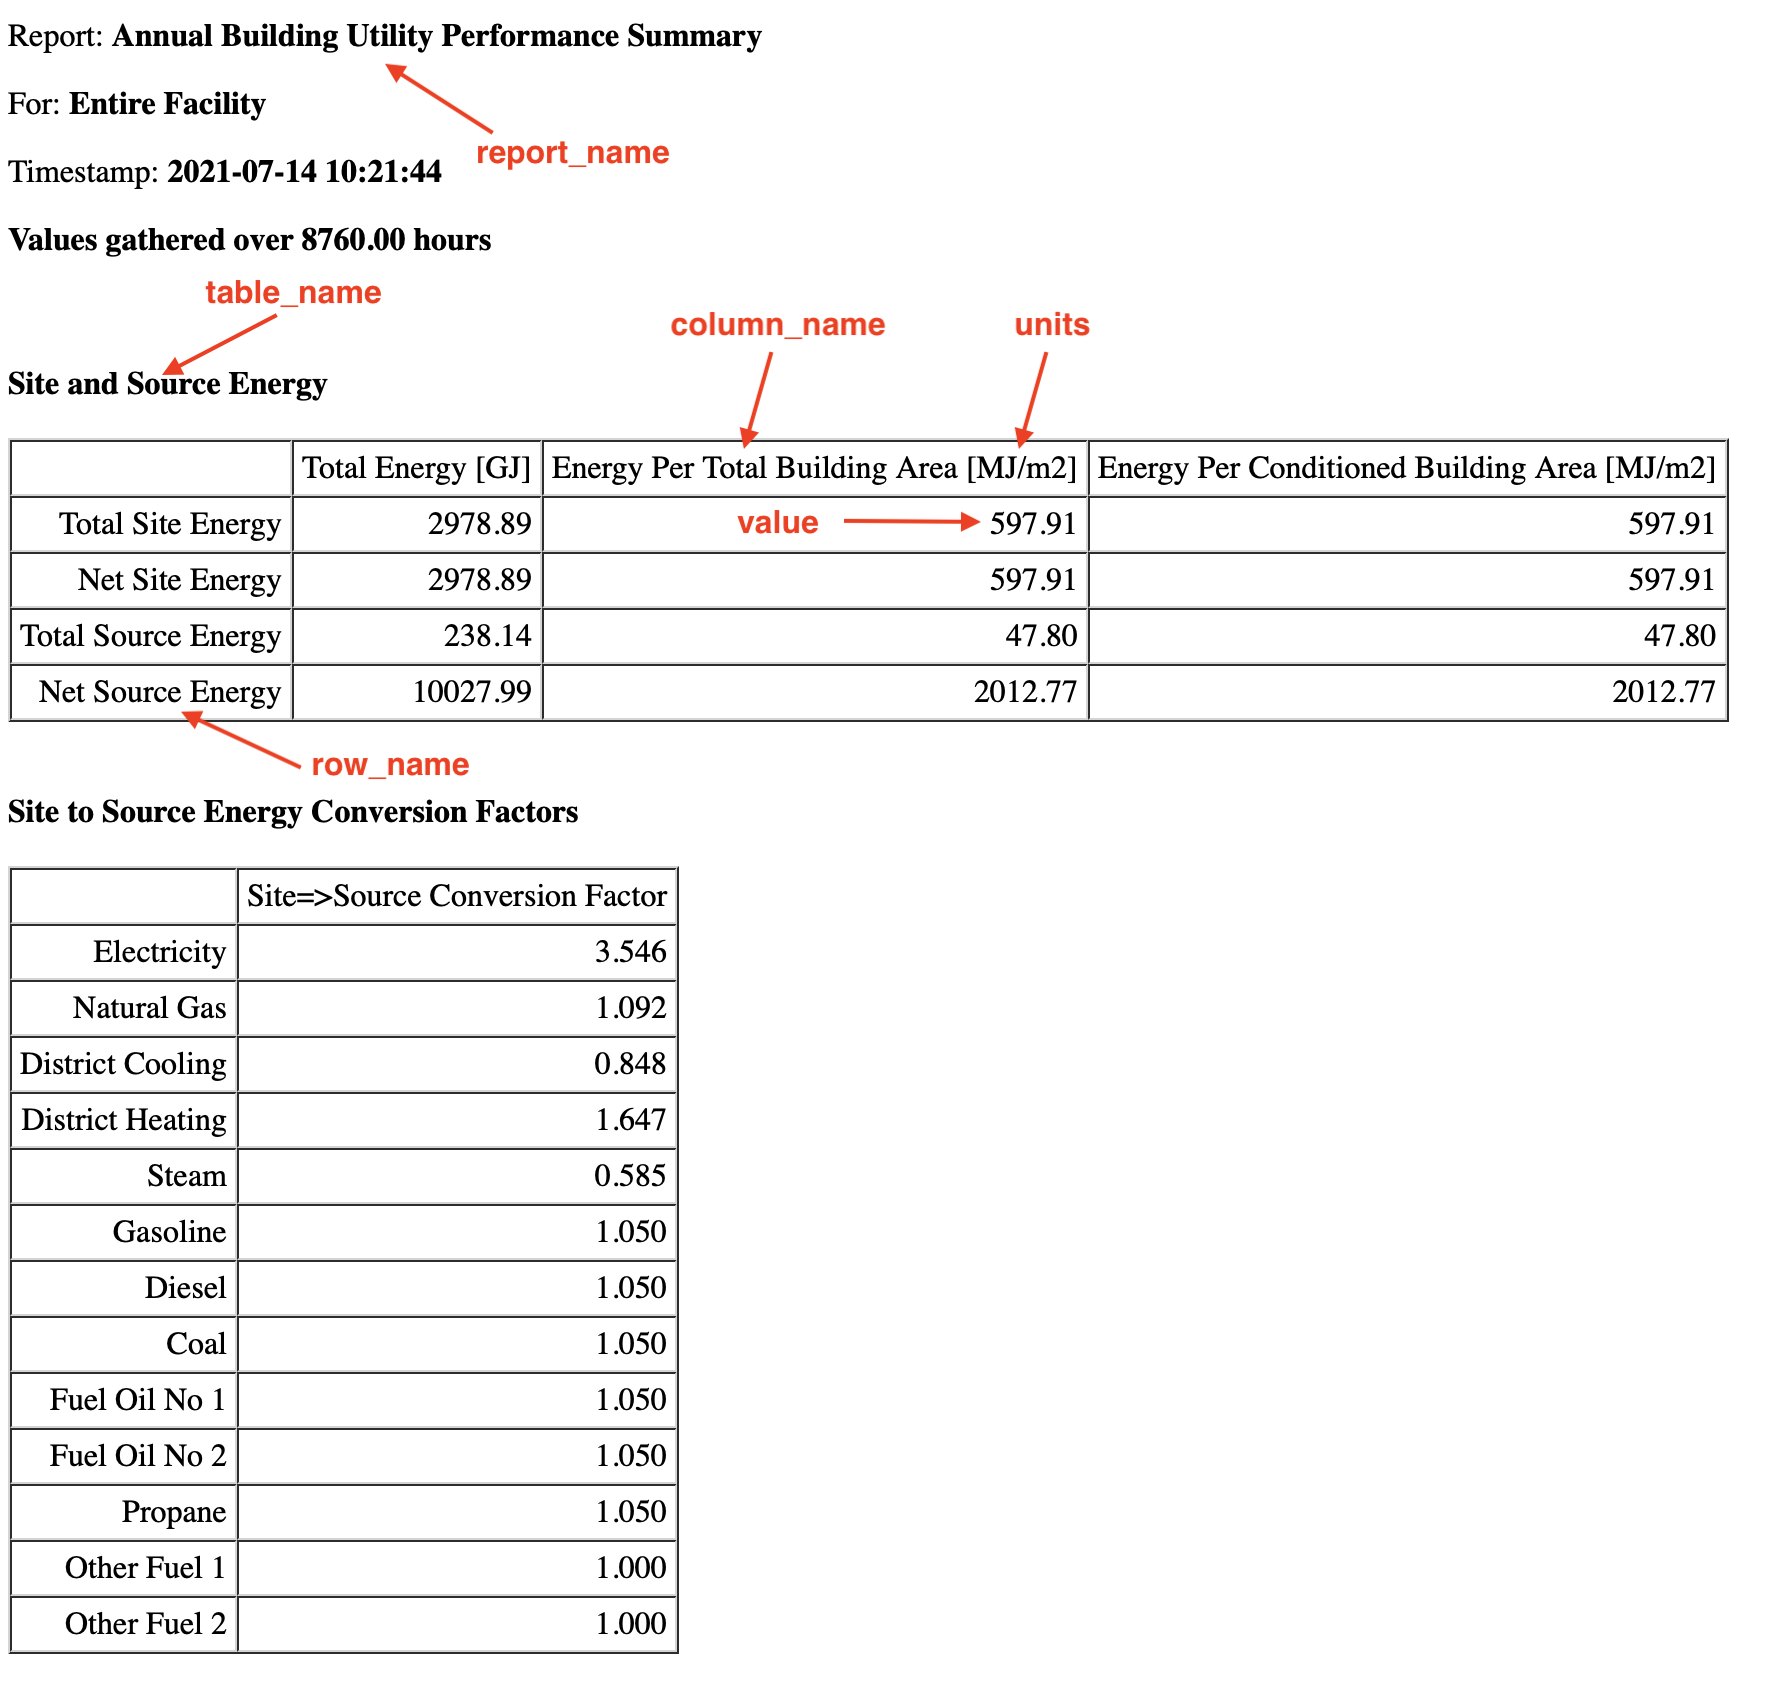
Figure 10.1: Report summary html file output from EnergyPlus
In eplusr, the EplusJob class provides different methods to extract simulation
results. To bring the summary reports into R, you can use the tabular_data()
method, which extracts all the EnergyPlus summary reports into a R data.table.
The data table consists of the following nine columns.
- case: Name of the simulation case. The case variable is useful for filtering the simulation results when running multiple parametric simulations. However, since we are only running one simulation in this example there is only one unique case.
- index: Row index for the table
- report_name: Names of the summary report that the observation belongs to
- report_for: The context that the summary report is for.
- table_name: The name of the table within the report that the observation belongs to.
- column_name: The name of the column within a table that the observation belongs to.
- row_name: The name of the row within a table that the observation belongs to.
- units: The unit of the observation.
- value: The value of the observation. Note that by default, this is stored as a character vector.
report <- job$tabular_data()
colnames(report)
## [1] "case"        "report_name" "report_for"  "table_name"  "column_name"
## [6] "row_name"    "units"       "value"
To illustrate, refer back to Figure 10.1 on what the
arguments report_name, table_name, column_name, row_name, units, and
value would correspond to in the html summary report. You can easily retrieve
the Total Site Energy in Energy Per Total Building Area from the
Site and Source Energy table in the AnnualBuildingUtilityPerformanceSummary
report. Note that there are no whitespaces when specifying the report_name.
report_example <- report %>%
    filter(
        report_name == "AnnualBuildingUtilityPerformanceSummary",
        table_name == "Site and Source Energy",
        column_name == "Energy Per Total Building Area",
        row_name == "Total Site Energy"
    )
Other examples as follows.
You can retrieve end use energy consumption data and arrange them in descending value.
report_end_use <- report %>%
    filter(
        table_name == "End Uses",
        grepl("Electricity|Natural Gas", column_name, ignore.case = TRUE),
        !grepl("total", row_name, ignore.case = TRUE)
    ) %>%
    mutate(
        value = as.numeric(value) * 277.778,
        units = "kWh"
    ) %>%
    select(row_name, column_name, units, value) %>%
    rename(category = row_name, fuel = column_name) %>%
    arrange(desc(value)) %>%
    drop_na()
You can retrieve normalized metrics and group them by their fuel type.
report_norm <- report %>%
    filter(
        table_name == "Utility Use Per Conditioned Floor Area",
        row_name != "Total"
    ) %>%
    mutate(
        value = as.numeric(value) * 0.2777777777777778,
        units = "kWh/m2"
    ) %>%
    filter(value > 0.0) %>%
    select(category = row_name, fuel = column_name, units, value) %>%
    group_by(category) %>%
    summarise(total = sum(value))
You can also retrieve details of the model inputs from the summary reports.
Opaque exterior of the building envelope.
report_op_ext <- report %>%
    filter(
        table_name == "Opaque Exterior",
        grepl("Azimuth|U-Factor with Film", column_name)
    ) %>%
    mutate(value = as.numeric(value)) %>%
    select(row_name, column_name, units, value)
Exterior fenestration of the building envelope.
report_ext_fenestration <- report %>%
    filter(
        table_name == "Exterior Fenestration",
        !grepl("total", row_name, ignore.case = TRUE)
    ) %>%
    mutate(value = as.numeric(value)) %>%
    filter(value > 0) %>%
    select(row_name, column_name, units, value)
## Warning in mask$eval_all_mutate(quo): NAs introduced by coercion
You can refer to the section “Output:Table:SummaryReports” in EnergyPlus’s “Output Details and Examples” documentation for the list of available reports.