Preface
Introduction
This is the book I use to support my teaching of building energy simulation-related courses at the Department of the Built Environment, National University of Singapore. This book will introduce you to building energy simulation and how to perform data analytics with energy models using R. You will learn how to get your model into R, simulate it, transform the inputs and outputs, and visualize and explore them. This book is designed to be interactive and for you to learn by doing. It is highly recommended that you do not copy and paste all the code in this book but instead type them out. Copying and pasting snippets of code isn’t the best way to learn because more often than not you are just reading the code at an abstract level without understanding what it does. In contrast, typing the code forces you to try to understand what the code is doing.
The online version of this book is free to use, and is licensed under the Creative Commons Attribution-NonCommercial-ShareAlike 4.0 International License.
Note that this book is still work in progress and some chapters in the book are currently just placeholders that will be completed over time.
Structure of this book
The book is divided into six parts. The code in each chapter is self-containing. Each chapter will contain all the packages and objects needed to run the code and objects created in previous chapters need not be carried over for them to work.
Part I introduces R’s basic syntax, which should be sufficient to get most readers started on the subsequent parts of the book. Part II introduces the basic usage and will show you how to get your EnergyPlus model into R, run the simulation, extract the predefined reports and visuaize them. Part III provide details on extracting and modifying various model inputs/outputs, and provide examples of data exploration that can be applied to the model inputs/outputs. Part IV shows how to programmatically define energy efficient measures using functions and demonstrates the process of performing parametric simulation and it’s analysis. Part V shows example application of advanced techniques such as sensitivity analysis, optimization, and Bayesian calibration to building energy simulation. Part VI introduces workflows and tools for reproducing building energy simulation using R.
Prerequisites
This book assumes some theoretical knowledge of building physics and building energy simulation. Some programming experience is preferred but not necessary. To run the code in this book, you will need to install EnergyPlus, R, RStudio, and a handful of R packages that we will introduce as we go along in this book.
R and RStudio
To download and install the most recent version of R, I would recommend the precompiled binary distribution of the base system and contributed packages that you will find at the top of R’s project webpage at https://cloud.r-project.org. R Studio is an Integrated Development Environment (IDE) for R.
R Studio increases your productivity when working with the R programming language by combining different features such as syntax highlighting and auto-completion into a single application. You can download and install RStudio from https://www.rstudio.com/products/rstudio/download.
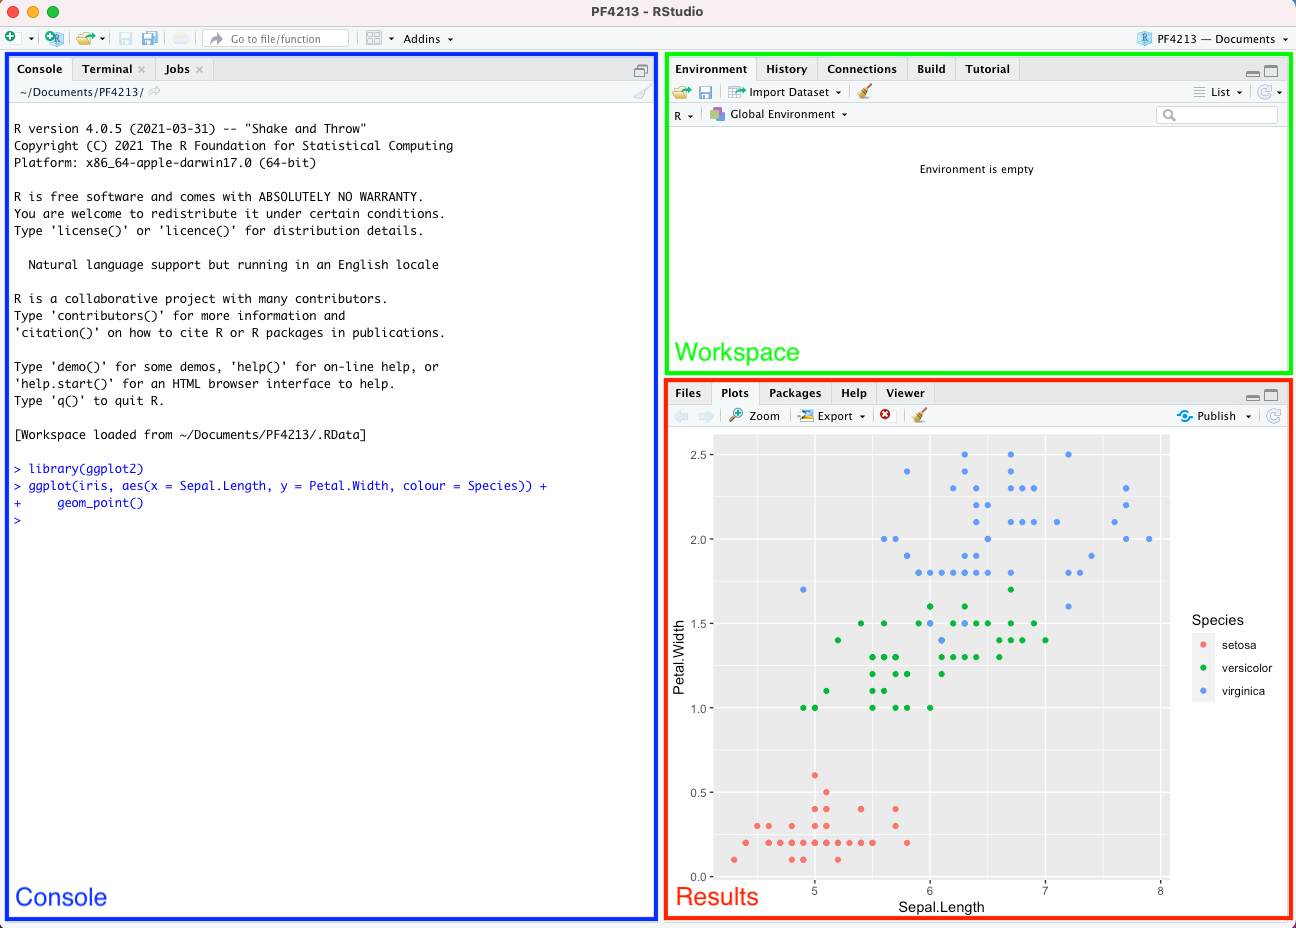
Once you have downloaded and installed RStudio, you will see a similar window to that shown in image below that comprises of:
Console window: This is the window where you type in R code, press enter, and the results are returned.
Workspace window: The Environment tab in this window is where all the objects that you have created will show.
Results window: This window is typically used for visualizing graphs (Plots tab) and for getting help by accessing the documentation pages for R (Help tab).
R Packages
R has thousands of packages hosted on the Comprehensive R Archieve Network (CRAN). These packages contains functions developed and shared by the community. In this book we will be using several R packages. The main packages include the tidyverse and eplusr package. We will introduce the other packages used in this book as we go along.
To install any R package, open R Studio and type
install.packages("<package name>")For example, to install the tidyverse package
install.packages("tidyverse")Note that you will not be able to use the R package until you load it into your
environment using the library() function. To load both the tidyverse
package, type:
EnergyPlus
EnergyPlus is an open-source whole-building energy simulation engine that is widely used by the research community and industry practitioners. EnergyPlus is also the simulation engine supporting many energy simulation applications [1], and it has been and continues to be supported by the U.S. Department of Energy (DOE) [2].
Different releases of EnergyPlus for different platforms (Windows, Linus, or Mac) can be downloaded from https://energyplus.net/downloads. In this book, we will be using EnergyPlus version 9.4.0.
You can also install EnergyPlus via RStudio using the eplusr package. First, install eplusr:
install.packages("eplusr")Then load the library onto RStudio
You can then install EnergyPlus version 9.4.0 by typing
install_eplus(ver = 9.4)Conventions
In this book, code that you can type and run directly in R will appear within
grey boxes like this or in the form of code blocks like this:
1 + 1
## [1] 2
When presenting R code, prompts > will not be added and the output from
running the code will be commented out with ## as shown in the example above.
This is for your convenience so that it is easy to type or copy the code so that
you can run it yourself.
Before you begin
R Project
The Figure below shows the steps to create a project called r4bes that you
will be using for this book. To create a project, select File > New Project
from RStudio’s menu bar. This launches a window that provides you with options
for creating a project. Select the New Directory option followed by
New Project. You can then specify the Directory name for your new project
and the directory where it will reside. Notice the file with .Rproj extension
that was created along with the project. This is the project file that you
double-click to open a project. When you open a project, the current working
directory is automatically set to the project directory.
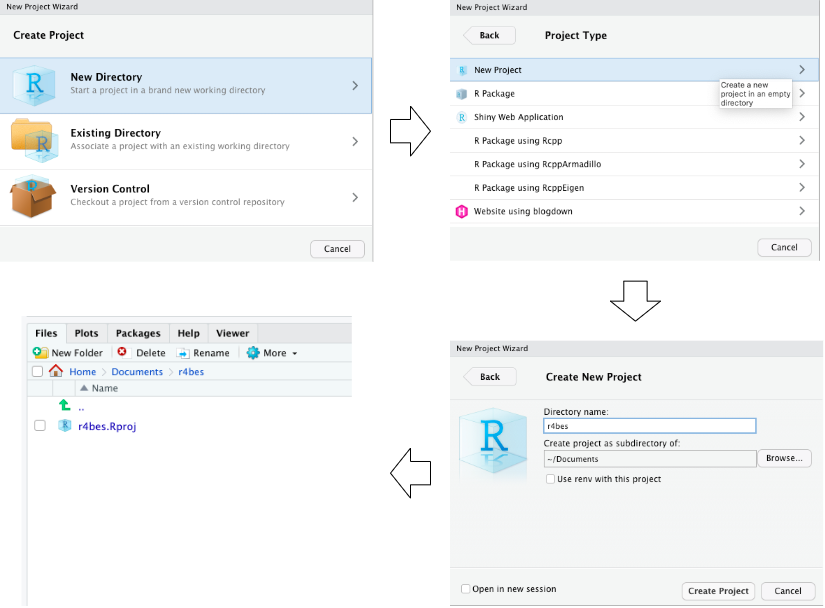
Try it now! Quite RStuido and then navigate to and open the r4bes.Rproj file.
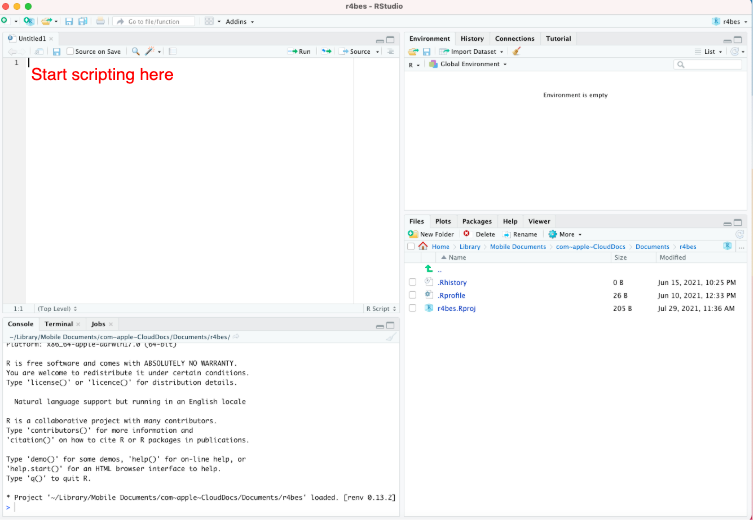
Scripting
Once the project folder is set up, you can create a new R Script with
File > New File > R Script. An R Script is basically a text file with a .R
extension that allows you to keep track and save your R code.
Example files
To ensure the reproducibility of the examples in this book, you will download the data folder from this link and place it in the project folder you have just created.
Your project folder should now have the following file structure.
./r4bes/
  +-- r4bes.Rproj
  +-- data/
      +-- building_meter.csv
      +-- building.csv
      +-- epw
          +-- USA_IL_Chicago-OHare.Intl.AP.725300_TMY3.epw
      +-- idf
          +-- RefBldgMediumOfficeNew2004_Chicago.idf
      +-- iris.csv
building_meter.csv is an example energy meter output file from the the U.S.
DOE medium office energy model (i.e., RefBldgMediumOfficeNew2004_Chicago.idf).
The dataset has a temporal resolution of 1 hour and comprises of 10 variables
(the Date/Time and 9 other energy meters) and 8760 observations.
building.csv is a timeseries dataset from an actual building consisting of
1324 observations and 2 variables (date/time and building electricity
consumption). The dataset has a temporal resolution of 30 minutes.
USA_IL_Chicago-OHare.Intl.AP.725300_TMY3.epw is the latest Typical
Meteorological Year weather dataset for the Chicago Ohare International Airport.
RefBldgMediumOfficeNew2004_Chicago.idf is a building energy model developed by
the U.S. Department of Energy (DOE) to act as a Commercial Reference Building
for medium offices [3]. We use the DOE reference building because it
is well established and widely used. More importantly, it is publicly available
and comes distributed with EnergyPlus as example files, making the examples and
code in this book easier to follow and reproduce.
iris.csv is a popular machine learning dataset about the Iris flower. The
dataset consists of 50 observations and 5 variables.
Once you have downloaded the data folder into your R project directure, the
following code should all return TRUE.
library("here")
## here() starts at /home/runner/work/r4bes/r4bes
file.exists(here("data", "iris.csv"))
## [1] TRUE
file.exists(here("data", "building.csv"))
## [1] TRUE
file.exists(here("data", "building_meter.csv"))
## [1] TRUE
file.exists(here("data", "idf", "RefBldgMediumOfficeNew2004_Chicago.idf"))
## [1] TRUE
file.exists(here("data", "epw", "USA_IL_Chicago-OHare.Intl.AP.725300_TMY3.epw"))
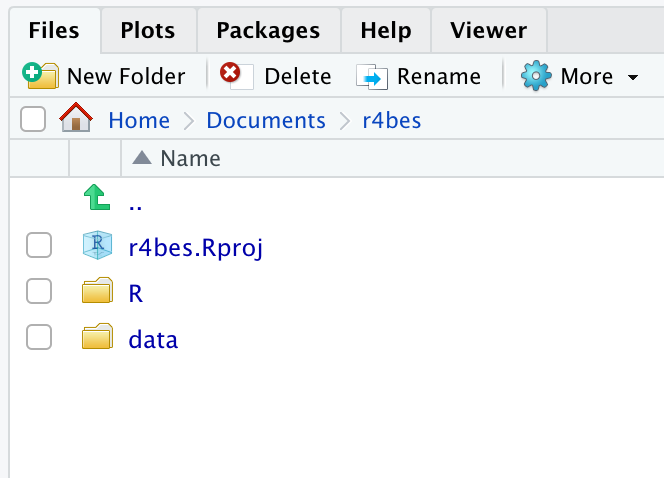
## [1] TRUEProject structure
You should also create a new folder called R in the newly created R project.
This folder will be used to house all R code that you will write as you go
through this book. You can create a new folder in RStudio by navigating to the
RStudio’s results window, select the Files tab and click on New Folder and
enter R.
Your project folder should now look like this.
Style guide
We recommend using the Tidyverse Style Guide by Hadley Wickham. To summarize we recommend the following
R File names should be meaningful and end in
.R. Avoid using special characters when naming files and use onlylowercase, hyphens-, and underscores_.snake_case(only lowercase letters, numbers, and_) for all object and function names. Function names should also reflect what it does.Use two white spaces when indenting your code
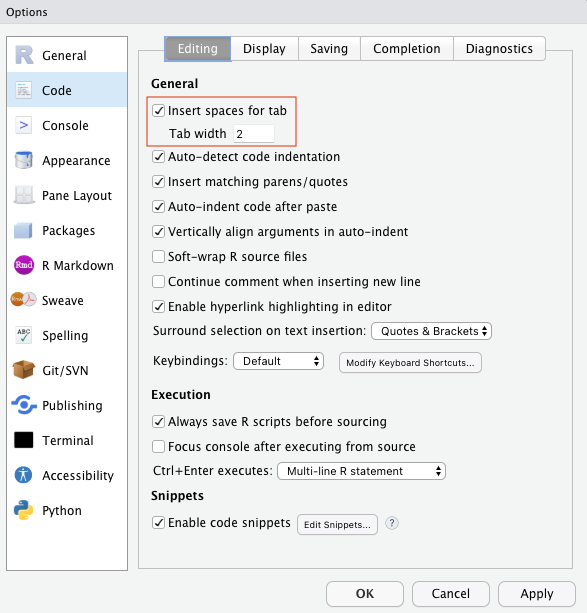
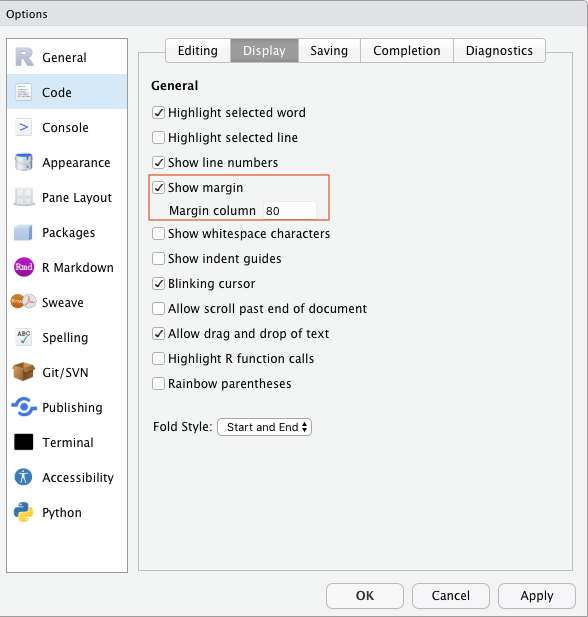
- Line length should not exceed 80 characters